UReport.
Your Codex and Claude Code limits, live in the menu bar.
- Platform
- macOS
- Status
- In development
- Year
- 2026
Codex and Claude Code each meter you against rolling windows that reset on their own schedules. UReport keeps every one of them in the menu bar — percent used, percent left, and when it turns over — so you find out where you stand before a long session stops, not during it.
Screenshots
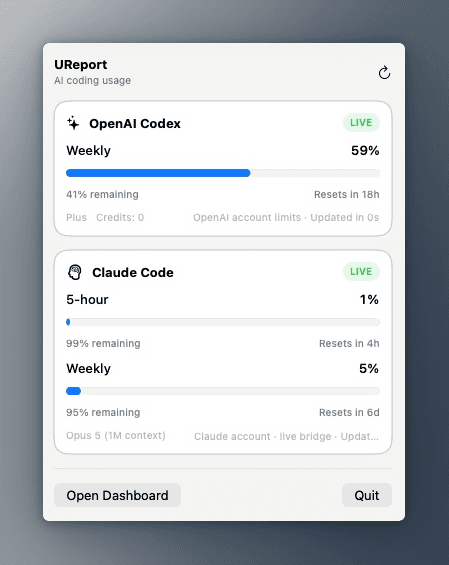
Menu barWhere you stand on both tools, in about a second. 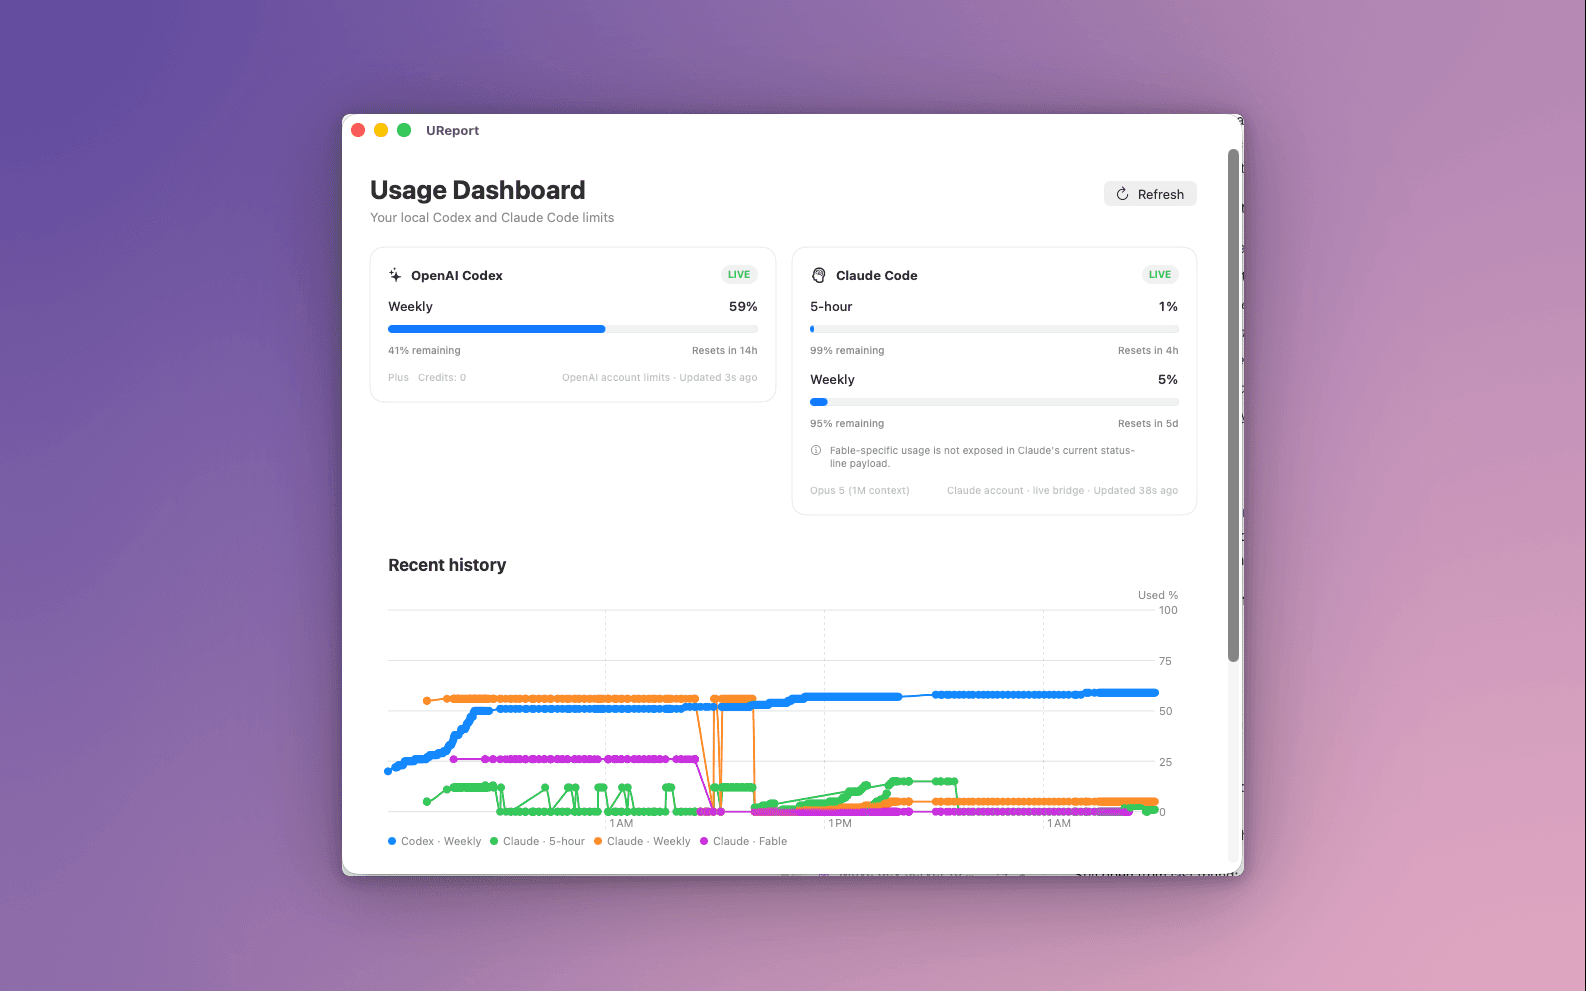
DashboardPer-window detail, plus how usage moved across the day.
Features
Both tools, one glance
OpenAI Codex and Claude Code sit side by side in a menu-bar popover. Each shows how much of the window you've used, how much is left, and a live badge when the reading is current.
Every window tracked separately
Claude Code meters a 5-hour window and a weekly one at the same time; Codex runs on a weekly. Each is tracked independently, with its own bar and its own number.
Know when it resets
Resets in 4h. Resets in 5d. Every limit carries its own countdown, which is usually the number that actually decides whether you start the big refactor now or after the window turns over.
Recent history
A dashboard chart plots each limit over time — Codex weekly, Claude 5-hour, Claude weekly — so you can see the shape of a working day instead of a single instantaneous percentage.
Reads your local state
Usage comes from the Codex and Claude Code state already on your Mac, alongside your account limits, and refreshes on a live bridge with a last-updated stamp so you know the reading is fresh.
Plan context, not just percentages
Tier, remaining credits, and the model currently in play are shown next to the bars, so a number that looks alarming can be read against what you're actually subscribed to.
A glance, or the whole picture
The popover answers "am I fine?" in about a second. Open Dashboard when you want the history chart and the per-window detail behind it.
Under the hood
- Platform
- macOS
- Surfaces
- Menu-bar popover and dashboard window
- Providers
- OpenAI Codex and Claude Code
- Windows
- Codex weekly; Claude Code 5-hour and weekly
- Source
- Local Codex and Claude Code state
- Refresh
- Live, with a last-updated stamp